April 2, 2025
Fred Floss, Lisa Parshall, and Laurie Buonanno
The New York State Constitution provides for several types of “general purpose” governments. These are counties, cities, towns and villages. There are also unincorporated places within incorporated towns—unofficially designated as hamlets. Depending on what is counted, NYS has over 10,000 units of local government, ranking New York ninth among all states for the number of general-purpose municipalities (U.S. Census Bureau, 2017). Table 1.1 contains an accounting of the various types of local governments that operate in New York State. General and special purpose governments are enumerated by region in Table 1.2.
| Table 4.1 Local Government Entities Count (as of 2022) | |
| General-Purpose Governments | |
| Counties | 57 (outside of NYC) |
| Cities | 62 (including NYC) |
| Towns | 993 (including 5 coterminous towns-villages) |
| Villages | 533 (including 5 coterminous towns-villages) |
| Total General-Purpose Governmental Entities | 1,585 |
| Special-Purpose Governments | |
| School Districts | 690 |
| Fire Districts | 902 |
| Town Special Districts | 7,827 |
| County Special Districts | 147 |
| Independent Special Districts | 70 |
| Soil and Water Conservation Districts | 58 |
| Consolidated Health Districts | 38 |
| Business Improvement Districts | 128 |
| Housing Authorities | 144 |
| Industrial Development Agencies | 107 |
| Other Local Authorities | 72 |
| Urban Renewal Agencies | 41 |
| BOCES | 37 |
| Charter Schools | 334 |
| Community Colleges | 36 |
| Library Systems | 23 |
| Public Libraries | 410 |
| Regional Planning Boards | 7 |
| Fire Companies and Departments | 1,804 |
| Free Association Libraries | 347 |
| Local Development Corporations | 333 |
| Total Special-Purpose Governments | 13,615 |
| Data Source: OSC, Number of Local Governments and Other Local Entities, February 2022. OSC Definitions: General-purpose local governments perform a variety of municipal functions; have elective governing boards; possess the power to, among other things, levy or cause the levy of taxes and assessments; issue general obligation indebtedness backed by a required pledge of their faith and credit; and adopt local laws pursuant to home rule powers. Special purpose local governments perform limited functions and usually have an elective governing board. Most possess the power to levy or cause the levy of taxes and issue general obligation indebtedness (backed by a required pledge of faith and credit). They do not have home rule power to adopt local laws. | |
Table 1.2 The Number of Cities, Towns and Villages by Region
| City | Town | Village | Grand Total | |
| Capital Region | 10 | 108 | 42 | 160 |
| Central New York | 6 | 94 | 45 | 145 |
| Finger Lakes | 4 | 126 | 61 | 191 |
| Hudson Valley | 12 | 105 | 81 | 198 |
| Long Island | 2 | 13 | 97 | 112 |
| Mohawk Valley | 8 | 105 | 57 | 170 |
| North Country | 3 | 131 | 54 | 188 |
| Southern Tier | 6 | 125 | 58 | 189 |
| Western New York | 10 | 125 | 54 | 189 |
| New York City | 1 | 1 | ||
| Grand Total | 62 | 932 | 549 | 1543 |
Every resident of NYS lives in either a city, reservation or a town. Villages are different in that they are also part of a town, while providing additional services. Towns, cities and villages range greatly in geographic size and population. The Town of Red House in Cattaraugus County has a population of 27 people, while the Town of Hempstead in Nassau County has a population of 793,409. The Town of Webb (Old Forge) in Herkimer County, at 452 square miles, is the town with the largest land area in NYS, while the coterminous town-village of Green Island in Albany County at 0.7 sq. miles, is NYS’s smallest town, by area.[1] The Town of Amherst—a suburb of Buffalo—has a population of 129,595 and is 53.2 sq. miles while Buffalo, a city, has a population twice Amherst at 278,349 but is slightly smaller than Amherst at 52.5 sq. miles. Cities, towns, and villages vary in both population size and density, but each has the responsibility to provide services to their residents.
Benjamin (1990) notes that as municipal powers have evolved, the legal distinctions between the city, town, and village forms of government have become less meaningful over time. Yet, because municipal designation is not based on population, there is great variability in size among municipalities of the same class (and therefore their fiscal and governing capacities).[2]
Local government reflects the notion that individuals make choices on where to live, often based on the amenities of the location. Two classic articles, one by Charles Tiebout (1956) and the other by James Buchanan (1965), posited models as to why cities, towns and villages form and why some municipalities are bigger or smaller than others.[3] Families may move to get into perceived better school districts, or they may decide they need to be close to work. Some will look at taxes or the size of a house they may purchase. Over time these choices may change. At first a family with young children may look for the best school, but once all their children graduate this may become less important. In and out migration will naturally happen as needs change and therefore is not necessarily a good or bad indicator of how well a municipality is run.
The Responsibilities and Powers of New York’s Local Governments
Local governments receive their power from two articles in the NYS Constitution: Article IX Local Governments—since 1963 often referred to as the “Home Rule” article when New York’s voters approved a home rule amendment to Article IX—provides for the authority of local governments to exercise self-government and Article VIII, which lays out the rules for local finance. New York thus places the general-purpose municipal forms on equal constitutional footing. Nevertheless, the exercise of home rule is circumscribed through State legislation, preemption, and matters that are deemed to be of state concern (New York State Bar Association – The Committee on the New York State Constitution, 2016).
Article IX, §2(c)(ii)(1-10) enumerates the ten areas over which municipalities may enact local law. This article also requires the State Legislature to adopt a Statute of Local Government that grants additional powers to be “repealed, diminished, impaired, or suspended” only by State legislation enacted in two successive years (sessions). Additional protections are provided under the General Municipal Law, as well as County, Town, Suburban-Town, and Village laws.
Thus, New York’s local governments are general purpose municipal corporations and are semi-independent entities (New York State Department of State, 2023). They are empowered in their jurisdiction to provide services such as police and fire protections, social services, infrastructure (water, snow plowing, etc.), and judicial services. In our federalist system, local government “is the point of delivery for many governmental services and is the level of government most accessible to and familiar with residents” (New York State Department of State, 2023). As such, they are the closest governments to the people.
Counties in New York State
As Administrative Units of State Government
Counties were established in 1683 when the General Assembly of Freeholders passed the Charter of Liberties and Privileges, which divided the New York colony into 12 counties. NYS’s existing 62 counties were created by legislative acts. Five counties are NYC boroughs and therefore no longer function as counties—they have no county seats and are governed by the NYC Council.[4] (See Figure 1.1 for a NYS map subdivided by counties.) Therefore, generally in NYS when we speak of counties, we are referring to the 57 counties outside of NYC proper. Counties are governed by Article IX of the State Constitution, the Municipal Home Rule Law and the Statute of Local Governments.
Figure 1.1 New York State Counties
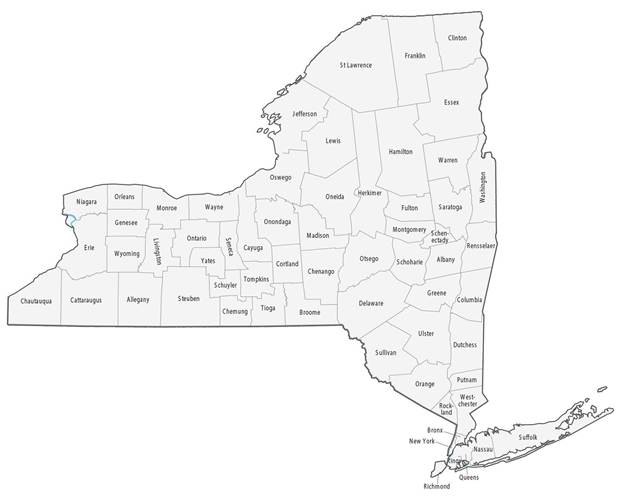
Source: GIS Geography. Retrieved from https://gisgeography.com/new-york-county-map/
New York’s counties were originally conceived of and treated by Albany as handmaidens of the State, that is, as little more than administrative instruments for carrying out State laws and policies. The movement to revise the role and operation of counties began with Governor Alfred E. Smith in 1926. The NYS Constitution was amended in 1935 to authorize the NYS Legislature to enact alternative forms of county government and at the November 1958 general election, voters approved an amendment to the Constitution permitting counties outside of NYC to prepare, adopt, and amend their charters (New York Department of State, 2023). When this “Home Rule Amendment” took effect January 1, 1964, it gave counties “broad powers to draft and adopt their own charters by action of the legislative body and approval of the voters at a general or special election” (that is, to become a “home rule” charter county) (New York Department of State, 2023, p. 1). Since Governor Smith’s new vision for county-State relations, “county government has undergone profound changes in both form and function” enabling counties to become “true units of local government endowed with their own powers to carry out an extensive array of new duties and service responsibilities (New York Department of State, 2023, p. 1). Counties may operate under a county charter (the residents of 22 counties have voted to do so) or operate under County Law.[5] One of the main features of charter counties is in the establishment of a distinction between the legislative and executive branches. This is because charter counties must establish a county administrator (typically called “county executive”) with powers independent of the legislative body. Administrators in non-charter counties exercise power delegated to them by the legislature and act on its behalf (New York Department of State, 2023, p. 4). Typically, counties with larger populations and big county budgets have opted to become charter counties because a strong executive is needed to manage the county more effectively, expeditiously, and efficiently.
As Self-Governing Units
As we alluded to in the previous section, the role of counties and their relationship with Albany substantively changed throughout the twentieth century. In many respects, New York’s counties have moved closer to the ways in which counties function in southern and western states as “regional governments,” particularly with respect to the sharing and provision of services. Although undoubtedly the major function of the county from Albany’s point of view is to act as an “administrative arm” of the State, counties form unique identities and their own ideas about what is best for their county. While the 57 counties all operate under the laws described in the previous section, the fact is the relationship between the State and her counties necessarily differs for a variety of reasons: location, urban/suburban/rural, industry, wealth. So, for example, a comparison between Suffolk County on the Eastern half of Long Island with a population of 1.5 million residents, a median household income of $87,778, and median real estate value of $395,200 and Allegany County located on the western portion of the Southern Tier with a population of 48,109, a median household income of $42,095, and a median real estate value of $67,600 suggests the two counties cannot be expected to have equal influence in State/county relations. Four counties—Erie (Buffalo), Monroe (Rochester), Onondaga (Syracuse), and Westchester (Yonkers)—manage a complex amalgamation of urban, suburban, and rural areas, while 21 counties (including suburban Suffolk County) contain no cities at all. Location also influences the way a county’s residents see themselves. Growing up and working on the Pennsylvania border, around the Great Lakes, on the Canadian border, the Capitol region, or in the metropolitan NYC region is not only evidenced by diverse patterns of speech, but in the particularistic regional cultures.
Finally, because counties have access to their own source of income (property taxes, local sales tax, and other sources such as hotel occupancy taxes)—in addition to state and federal aid—wealthier counties can furnish nicer parks and recreation, support cultural programming, provide excellent youth and senior services, and other quality of life services.
* * *
The stylized history of towns, villages and cities began in the 1950s with families moving to first ring suburbs to purchase bigger houses with more land and better schools. The first wave of suburbanization was also a resegregation as most of the families moving to the suburbs were richer and white.[6] This left the city centers with more disadvantaged families, while still having to provide the same level of services as before. Industry also changed during this period and looked for cheap land to build larger plants, land that was not available in mature cities. Industrial Development Agencies (IDAs) handed out tax breaks to lure companies out of the more populated towns and cities. IDA practices started an “arms race” that contributed to suburban sprawl. Once towns and villages became higher density, these municipalities began to find themselves in the same predicament as the older city centers. Since towns and villages are landlocked due to NYS’s prohibition on annexations, they eventually run out of green space and economic growth slows, making it harder to add new and improved services without large tax increases. In Upstate New York, this is the situation in which most cities, towns and villages find themselves. Consequently, local elected leaders face the difficult task of managing local needs under tax constraints and with little help from state budgets which are strapped with tight budgets and federal mandates.
Over the past few decades, villages, towns, cities, and counties have complained about what they perceive as an uptick of “state concern,” including unfunded mandates (State imposed statutory and regulatory requirements that are not accompanied by State funding). Control over property taxes, for example, had always been considered a matter for local control. Yet the State was able to claim “interest” when in 2011 it intervened in local government financing by temporarily enacting the Property Tax Cap (the rationale for State intervention being that high property taxes drive businesses and individuals from the State). While the idea of property tax caps was not a new concept either in NYS or in the country, Parshall explains (Chapter 9) that Governor Cuomo tied the Property Tax Cap (discussed below) not only to longstanding concerns such as tax burden induced outmigration (arguably a state interest), but also to the expense of local government. If municipalities needed to raise property taxes to deliver services, perhaps it was time to consider regional government, service sharing, or even consolidation (whether dissolving villages into their towns or merging school districts).
Financing Local Government
Despite their substantial legal autonomy, localities are fiscally constrained by state-level policies in what has been characterized as a “controlling and complicated parent-child relationship” (Boyd & Dadayan, 2012, p. 36). New York localities shoulder significant fiscal responsibility in terms of taxing and spending (Boyd & Dadayan, 2012, p. 37; Schneier & Murtaugh, 2001, p. 42). In 2011, for example, local taxes constituted 53 percent of state-local taxes collected, compared to forty-three percent nationally (New York Division of Taxation and Finance, 2012 – Table 7).
Revenues
The Property Tax Cap, which the Legislature and governor made permanent in 2019 (at least partly due to the Trump administration’s elimination of the SALT deduction on federal income filings), restricts municipalities to annual increases in the tax levy to either two percent or the rate of inflation (whichever is lower).[7] The Property Tax Cap allows communities to override the cap through a 60 percent vote of the governing board (or the voters in the case of school districts). While local officials complained about the Property Tax Cap, it has been popular with voters (Malatras et al., 2019). The upshot is while more stable as a revenue source than sales or income taxes, property taxes are highly visible to residents.
The Property Tax Cap has also been a source of great concern to local governments because property taxes are the major way local governments fund their services (42.1 percent). Sales and use taxes account for 14 percent of total revenues (2021 data) (Office of the New York State Comptroller, 2023a). Figure 1.2 contains a breakdown per municipality type, where we can see important differences in the revenue sources. Counties, for example, rely more on sales taxes as a revenue source compared to school districts, which are more heavily reliant on property taxes. Significantly county and State sales tax revenues have been increasing since NYS began taxing internet sales.
Figure 1.2 Revenues by Source for New York’s districts, municipalities and counties
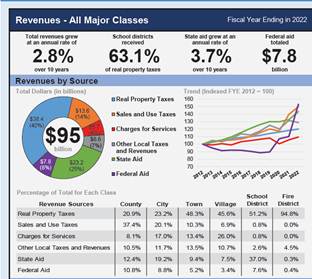
Property taxes vary greatly across the state and depend on the value and number of properties in a city, town or village. For example, the Village of Hempstead on Long Island has the highest village full valuation and a tax rate of 16.99% per $100,000 assessed valuation. The village of Gallway has the lowest rate at 0% (i.e., it does not use property taxes.) (See Table 1.3.)
| Table 1.3 Tax Rates (per $1000 evaluation) for Villages, Towns and Cities in 2023 [8] | |||||
| Villages | Towns | Cities | |||
| Rates | |||||
| Highest | 20.29 | 14.69 | 25.53 | ||
| Lowest | 0 | 0 | 2.92 | ||
| Average | 6.59 | 4.31 | 11.21 | ||
| Median | 5.98 | 4.04 | 10.87 | ||
| Standard Deviation | 3.93 | 2.29 | 4.49 | ||
Table Source: OSC, local government tax data.
Property taxes also vary by region as well. (See Table 1.4.)
| Table 1.4 Tax Levy, Values and Rates for Towns by Region in 2023 | |||
| Average of Town Levy | Average of Town Taxable Full Value | Average of Full Value Tax Rate (Levy per $1,000 Full Value) | |
| Capital Region | $1,794,883 | $1,000,625,317 | 2.87 |
| Central New York | $1,613,849 | $499,351,460 | 4.70 |
| Finger Lakes | $2,059,129 | $673,224,934 | 4.46 |
| Hudson Valley | $8,883,022 | $3,030,107,843 | 3.90 |
| Long Island | $65,289,374 | $51,942,361,019 | 2.81 |
| Mohawk Valley | $665,774 | $287,513,416 | 3.61 |
| North Country | $941,472 | $297,110,092 | 4.74 |
| Southern Tier | $1,136,381 | $336,436,859 | 4.87 |
| Western New York | $2,422,861 | $743,963,391 | 5.21 |
| Grand Total | $3,251,346 | $1,543,875,027 | 4.31 |
Table Source: OSC, local government tax data.
The actual amount of property taxes paid by a household will depend on the value of the home and the rate. (See Table 1.5.) Villagers pay both town and village taxes and both towns and village pay school and county taxes as well. The average town tax in 2024 was about $1,000 except on Long Island and in the Hudson Valley where it was almost double. This is not entirely surprising since these two areas are much wealthier and can afford to pay for more services.
Table 1.5 Town Property Taxes for Average Home by Region
| Region | Average Value of Home | Average Rate | Taxes |
| Capital Region | $300,186 | 2.87 | $862 |
| Central New York | $213,816 | 4.70 | $1,005 |
| Finger Lakes | $200,514 | 4.46 | $894 |
| Hudson Valley | $513,046 | 3.90 | $2,001 |
| Long Island | $702,655 | 2.81 | $1,974 |
| Mohawk Valley | $180,687 | 3.61 | $652 |
| North Country | $195,843 | 4.74 | $928 |
| Southern Tier | $167,521 | 4.87 | $816 |
| Western New York | $174,834 | 5.21 | $911 |
Source: (National Association of Relators, 2024)
School taxes are the largest part of property taxes: on average, 62.3 percent of all property taxes go to support schools (Office of the New York State Comptroller, 2019). School taxes also vary by region and whether one lives in a large city: specifically, the Big Five (New York City, Buffalo, Rochester, Syracuse, and Yonkers each with a “dependent school district”) do not levy school taxes.
| Table 1.6 Average School Tax by Region 2023 | ||
| Average of Tax Levy | Average of Full Value Tax Rate (Levy per $1,000 Full Value) | |
| Capital Region | $5,498,226 | 13.32 |
| Central New York | $3,552,331 | 16.95 |
| Finger Lakes | $4,524,072 | 16.52 |
| Hudson Valley | $20,600,732 | 17.51 |
| Long Island | $63,157,631 | 15.09 |
| Mohawk Valley | $1,568,028 | 15.32 |
| New York City | $0 | 0.00 |
| North Country | $1,552,687 | 12.49 |
| Southern Tier | $2,085,911 | 15.64 |
| Western New York | $4,226,721 | 13.86 |
| Grand Total | $8,252,283 | 15.20 |
In most cases school taxes are more than double those of town or village taxes. Across the state homeowners seem to be willing to pay much more in taxes if it is going to children and schools. In many cases, much more: in Long Island for example the average annual school property tax is $10,603. Since each year school budgets and taxes are put to a vote, communities decide to tax themselves. Property taxes in general are the stable base which a community and local elected officials can control. This is not true of the sales tax, which is more volatile and depends on what individuals buy. Making up 14 percent of total revenues (2022), the sales tax is an important part of a local municipality’s budget.
New York State provides a crucial revenue source through Aid and Incentives to Municipalities (AIM) for New York’s cities (other than NYC), towns, and villages. The program was created in 2005 to overhaul and consolidate the various local government assistance programs, awarding enhanced funding to cities that exhibited higher levels of stress and for which base-aid formulas were readjusted in the early 2000s.[9] AIM is popular with municipal officials because it is built on the general revenue sharing model (unrestricted usage), rather than the “strings-attached” funds the governor and State Legislature prefer. AIM, however, was stuck at $715 million for 15 years until in the 2024-25 State budget AIM increased by $50 million to $765.2 million. But in a sign that AIM could be once again reduced, the budget refers to the additional $50 million as the Temporary Municipal Assistance program (Williams, 2024). The legislature has occasionally overridden the statutory formulas to target aid to the largest cities. In nominal dollars, AIM funding has remained flat in nominal dollars since 2011. When adjusted for inflation, AIM has declined by $153 million (24 percent) since 2011, when the State real property tax cap was enacted (Office of the New York State Comptroller, 2022a, p. 11).
The NYS Office of the State Controller publishes an annual financial report on the condition of local governments. These reports indicate that cities, towns and villages are relying less on property taxes and more on sales tax to raise revenue. This reduction in property tax is a consequence of the state mandated Property Tax Cap (see above). Federal and State contributions have filled the gap with additional COVID-19 aid replacing the lost property taxes. As COVID-19 aid was running out along with higher inflation, municipalities found it difficult to balance their budgets; therefore, many local governments voted to override the cap to balance their budgets. The lack of revenue diversity and taxation limits means that local governments have not experienced steady and dependable economic growth.
Expenditures
Education typically comprises about half of spending, but the fastest growing costs are in the provision of social services, most of which are provided in NYS by her counties. (See Figure 1.3.) Because local government services are primarily labor intensive (providing education, health, arts, culture, recreation, and public safety) wages increase despite little or no companion increase in labor productivity. This “Baumol’s effect” (or “cost disease”) (see Baumol & Bown, 1965) occurs because despite low productivity gains in the services local governments provide, the competition for workers with the private sector drives up all salaries. Therefore, the cost of government services will rise at a faster rate than inflation because wages rise faster than other goods. Consequently, the services residents expect of their local governments will inexorably increase and put pressure on municipal budgets. The tension between local government employees over the lower wages they earn as compared to comparably educated workers in the private sector contributes to labor strife as workers seek to receive commensurate wages and benefits. Crises magnify the Baumol effect for three reasons. First, technological innovations aimed at reducing labor costs—the adoption of which accelerate during economic downturns—are less applicable to local governments. Second, economic downturns and other crises tend to create increased demand for local services. Third, economic downturns are accompanied by a decrease in local tax collections, particularly sales tax. Therefore, crises can place enormous pressures on local governments that were already struggling to remain fiscally solvent. Without outside help, many local governments will be forced to reduce the levels of service to which their residents have become accustomed.
Figure 1.3 Expenditures, NYS Local Government (2022)
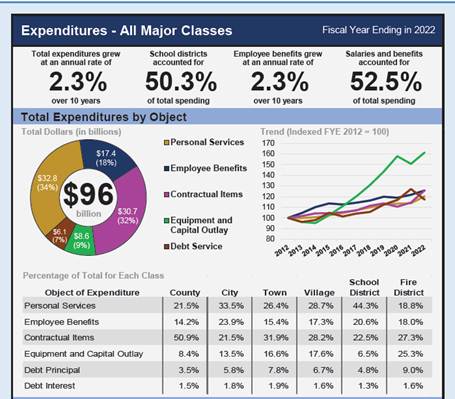
Even prior to the Great Recession, warning signs of fiscal pressure were starting to mount for New York’s localities. Between 1994 and 2004, municipal debt and debt service doubled for all classes. The OSC’s annual reports noted an increase in operational deficits and bonding and ever-increasing expenditures for employee salaries and benefits for all classes, along with growing Medicaid costs for counties. At the same time, the property tax burden began to grow, accompanied by an increased reliance on other revenue sources for local governments. Localities, in other words, were under increased budgetary pressure.
The OSC (2013, p. 1) defines fiscal stress as a “concept that seeks to measure the extent to which a local government is in danger of a fiscal crisis warranting intercession by the State, especially actions that could reduce local control” (Office of the New York State Comptroller, 2013, p. 1). How do we know if New York’s municipalities are experiencing fiscal stress? New York State Comptroller Thomas P. DiNapoli (D) created a tool to attempt to answer this question (Office of the New York State Comptroller, 2015, 2022b). Since 2012, his office has been collecting data and publishing scores for villages, towns, cities, counties, and school districts through his “early warning” Fiscal Stress Monitoring System (FSMS). The FSMS is meant to assist communities and school districts experiencing fiscal difficulties.[10] The FSMS provides a composite score based on a point (or percentage) calculation of several key indicators. (See Box 4.1.) Localities are designated as experiencing significant stress, moderate stress, or as susceptible to stress based on their fiscal score. Municipalities falling below a certain score threshold receive “no designation.” Communities in the “no designation” category may nevertheless be subject to stress resulting from “events and factors, such as natural disasters, economic shocks, or unanticipated emergency costs, that are not immediately captured in financial statements or by the indicators analyzed in [the] FSMS” (Office of the New York State Comptroller, 2023b, p. 2). The OSC defines “chronic stress” as municipalities that have experienced five or more years in a fiscal stress designation. Of the 20 entities to meet this definition (between FYE 2013-2022), 45 percent were cities, 30 percent were counties, 15 percent were towns, and 10 percent were villages (Office of the New York State Comptroller, 2023b, p. 1).
Box 4.1 Components of Comptroller’s Fiscal Stress Monitoring System
| Financial Indicators Year-end fund balancesOperating deficits/surplusesCash positionUse of short-term debt for cash flowFixed costs (evaluated for local governments only) Environmental Indicators For Local Governments population, age, poverty, property values, employment, dependence on revenue from other government units, constitutional tax limits, sales tax revenue Schools property values, enrollment, budget vote trends, graduation rate, free or reduced price lunch participation |
One must keep in mind that DiNapoli’s FSMS is a tool, but as with all such tools, it must be used with some caution for several reasons. First, services provided by localities, including counties, can differ throughout NYS, making it difficult to compare budgets. Second, stress tests do not account for the quality of services provided. Third, sometimes municipalities will report data to appear as if they are in fiscal stress to obtain competitive grants. Fourth, a large expenditure in one year, by say, for example, a small town purchases a snowplow truck, can make it appear as if that town is in fiscal stress. Fifth, filing reports with OSC is not mandatory and many towns, villages, and some cities do not file.[11] While persistent non-filing may indicate a “lack of proper financial management,” it must also be recognized that some municipalities do not wish to file for a variety of reasons (Office of the New York State Comptroller, 2023b, p. 7). In any event, the number of entities failing to file has steadily increased (Office of the New York State Comptroller, 2023b) And, lastly, filed reports may be incomplete. (See, Parshall, 2023 for a discussion about FSMS limitations as a diagnostic tool, particularly with respect to detecting fiscal stress in NYS’s villages.)
Fiscal stress designations differ from environmental stress which is separately scored by the OSC. Environmental indicators are those that may “pose challenges to the fiscal health of a municipality,” including declining property values, population loss, population age, poverty rates, unemployment, state aid, and other “demographic and resource-related measures” (Office of the New York State Comptroller, 2017, p. 9) Localities are assigned the same designations categories used for fiscal stress (i.e., no designation, susceptible to environmental stress, moderate environmental stress, or significant environmental stress) based on the OSC scoring system. Environmental scoring was also substantially revised in 2017 (meaning that data between 2012-2016 is not strictly comparable to data from 2017 onward). It is important to note that the environmental scores are not factored into the fiscal warning designations, nor do environmental scores correlate with the fiscal stress scores as calculated by the OSC (Bronner 2016, Parshall 2023). Whereas fiscal scores capture the internal fiscal stability of a locality based on key budgetary indicators, the environmental scores capture external conditions that pose governance challenges (such as unemployment rates, population change, or child-poverty rates). However, understanding environmental stressors does provide insight into local budgeting context and the economic challenges that cities face.
Baumol, W. J., & Bown, W. G. (1965). On the peforming arts: The anatomy of their economic problems. The American Economic Review, 55(1.2), 495–502.
Benjamin, G. (1990). The evolution of New York State’s local government system, Paper prepared for Local Government Restructuring Project at the Nelson A. Rockefeller Institute of New York.
Boyd, D. J., & Dadayan, L. (2012). Political conflict and intergovernmental fiscal relations. In R. F. Pecorella & J. M. Stonecash (Eds.), Governing New York State (pp. 25-50). SUNY Press.
Buchanan, J. (1965). An economic theory of clubs. Economica, 32(125), 1-14.
Buchanan, J. (1995/1996). Federalism and individual sovereignty. Cato Journal, 15(2-3), 259-268.
Buchanan, J., & Tullock, G. (1969). The calculus of consent. University of Michigan Press.
Malatras, J., Simons, N., & Cummings, M. (2019). As Albany debates a permanent property tax cap, how is the cap affecting school budgets? https://rockinst.org/blog/as-albany-debates-a-permanent-property-tax-cap-how-is-the-cap-affecting-school-budgets/
National Association of Relators. (2024). County median home prices and monthly mortgage payment. https://www.nar.realtor/research-and-statistics/housing-statistics/county-median-home-prices-and-monthly-mortgage-payment
New York Department of State. (2023). Adopting and Amending County Charters. https://dos.ny.gov/system/files/documents/2023/01/adopting-and-amending-county-charters_1.pdf
New York Division of Taxation and Finance. (2012). Electronic New York State tax sourcebook. https://www.tax.ny.gov/research/stats/statistics/policy-special/tax_sourcebook/new_york_state_tax_sourcebook_electronic_toc_tables_excel.htm
New York State Bar Association – The Committee on the New York State Constitution. (2016). Report and recommendations concerning constitutional home rule. https://nysba.org/app/uploads/2020/01/COSC-Report-on-Home-Rule-final-approved-by-the-House.pdf
New York State Department of State. (2023). Local government handbook. https://dos.ny.gov/system/files/documents/2023/06/localgovernmenthandbook_2023.pdf
Office of the New York State Comptroller. (1972). Statewide public authorities: A fourth branch of government? (Comptroller’s studies on issues in public finance, Issue 1).
Office of the New York State Comptroller. (2008). Research brief: 21st century state aid formulas: revenue sharing. https://www.osc.ny.gov/files/local-government/publications/pdf/researchbrief.pdf
Office of the New York State Comptroller. (2013). Fiscal stress drivers and coping strategies.
Office of the New York State Comptroller. (2015). Fiscal Stress Monitoring System factsheet. https://www.osc.ny.gov/files/local-government/fiscal-monitoring/pdf/factsheet.pdf
Office of the New York State Comptroller. (2017). Fiscal Stress Monitoring Systems results formunicipalities: Four year review, 2013-2016.
Office of the New York State Comptroller. (2019). Property taxes in New York State. https://www.osc.ny.gov/files/local-government/publications/pdf/property-taxes-in-nys-2019.pdf
Office of the New York State Comptroller. (2022a). Aid and incentives for municipalities: New York State’s local revenue sharing program.
Office of the New York State Comptroller. (2022b). Fiscal Stress Monitoring System manual. https://www.osc.ny.gov/files/local-government/fiscal-monitoring/pdf/system-manual.pdf
Office of the New York State Comptroller. (2023a). 2023 Financial condition report for fiscal year ended March 31, 2023. https://www.osc.ny.gov/reports/finance/2023-fcr/local-government
Office of the New York State Comptroller. (2023b). New York City economic and demographic indicators in relation to New York State. https://www.osc.ny.gov/files/reports/pdf/report-11-2024.pdf
Office of the New York State Comptroller. (2023c, September). Property Tax Cap: Exclusions. https://www.osc.ny.gov/files/local-government/property-tax-cap/pdf/retirement-exclusions-for-local-governments.pdf
Office of the New York State Comptroller. (2024a). Not filed and inconclusive municipalities for Fiscal Stress Monitoring System Fiscal Years ending 2023. https://www.osc.ny.gov/files/local-government/fiscal-monitoring/2023/pdf/2023-munis-not-filed.pdf
Office of the New York State Comptroller. (2024b). Number of local governments and other local entities. https://web.osc.state.ny.us/localgov/web-entity-map/pdf/entity-table-summary.pdf
Parshall, L. (2023). In local hands: Village government incorporation and dissolution in New York State. SUNY Press.
Schneier, E., & Murtaugh, J. B. (2001). New York politics: A tale of two states. M.E. Sharpe.
Tiebout, C. (1956). A Pure Theory of Local Expenditures 416-424. Journal of Political Economy 64, 416-424.
U.S. Census Bureau. (2017). 2017 Census of Governments – Organization. https://www.census.gov/data/tables/2017/econ/gus/2017-governments.html
Williams, D. (2024, April 24). State budget gives Buffalo, other cities, towns and villages an extra $50M. The Buffalo news. https://buffalonews.com/news/local/government-politics/budget-new-york-state-buffalo-aid-millions/article_ccf01a3c-019a-11ef-9cf4-d330b7313428.html
[1] Green Island is one of only six such town-village amalgams in New York. Office of the New York State Comptroller. (2024b). Number of local governments and other local entities. https://web.osc.state.ny.us/localgov/web-entity-map/pdf/entity-table-summary.pdf
[2] There is a classification system of first, second, and an option for suburban class towns by population under Town Law, but regardless of class, towns exercise similar municipal powers. See New York State Department of State. (2023). Local government handbook. https://dos.ny.gov/system/files/documents/2023/06/localgovernmenthandbook_2023.pdf
[3] The concept of citizens “voting with their feet” are elaborated in Buchanan, J., & Tullock, G. (1969). The calculus of consent. University of Michigan Press. and Buchanan, J. (1995/1996). Federalism and individual sovereignty. Cato Journal, 15(2-3), 259-268.
[4] The five counties are Richmond (Staten Island), New York (Manhattan), Bronx (Bronx), Kings (Brooklyn), and Queens (Queens).
[5] Charter Counties: Nassau (1936), Westchester (1937), Suffolk (1958), Erie (1959), Oneida (1961), Onondaga (1961), Monroe (1965), Schenectady (1965), Broome (1966), Herkimer (1966), Dutchess (1967), Orange (1968), Tompkins (1072), Rensselaer (1972), Albany (1973), Chemung (1973), Chautauqua (1974), Putnam (1977), Rockland (1983), Sullivan (1999), Ulster (2012), Steuben (2013) (New York Department of State, nd).
[6] Most cities experienced growth until the 1940s. Between 1950 and 2010, the median change in population of cities outside of NYC was -20%, compared to positive median change for villages (7.7%), towns (55.6%), and counties (32.8%) Office of the New York State Comptroller. (2013). Fiscal stress drivers and coping strategies. (p. 3).
[7] Naturally with such a law (as is in the case with property tax caps in other states), there are several exceptions. The Big Five Cities—New York City, Buffalo, Rochester, Syracuse, and Yonkers—(which have dependent school districts), are exempt. The tax levy also allows an excess of the two percent cap for budget increases due to contributions to the Employee Retirement System, the Police and Fire Retirement System, and the Teachers Retirement System. See Office of the New York State Comptroller. (2023c, September). Property Tax Cap: Exclusions. https://www.osc.ny.gov/files/local-government/property-tax-cap/pdf/retirement-exclusions-for-local-governments.pdf
[8] OSC, local government tax data.
[9] The funding formulas provide greater state assistance to cities (as compared to villages) on the “theory” that cities tend to have larger populations and more urban-related problems Parshall, L. (2023). In local hands: Village government incorporation and dissolution in New York State. SUNY Press. A Report by the OSC, however, highlighted the inequities of retaining general revenue sharing based on municipal classification. Recalculating AIM based on functional characteristics would have bumped 279 villages to the same level of revenue sharing as cities. Although the functions of municipal government have changed, the classifications upon which unrestricted state-aid formulas have been based have not, producing a system that is “no longer rational or equitable” Office of the New York State Comptroller. (2008). Research brief: 21st century state aid formulas: revenue sharing. https://www.osc.ny.gov/files/local-government/publications/pdf/researchbrief.pdf(p. 8).
[10] It is important to keep in mind that NYS Comptroller is an elected official and therefore must establish themselves as an independent watchdog for state finances, regardless of political party affiliation. Comptrollers, for example, have long bemoaned the power of public authorities and public benefit corporations to issue debt without taxpayers’ assent. Arthur Levitt, a Democrat/Liberal who served as Comptroller from 1958-1978 (holding the record for the longest tenure in this position), famously tangled with Nelson Rockefeller over the role of public authorities in financing projects. From his perch at the head of OSC he wrote, “These quasi-governmental agencies have been operating on a scale so massive that, in some instances, they overshadow the fiscal operations of the State itself.” See Office of the New York State Comptroller. (1972). Statewide public authorities: A fourth branch of government? (Comptroller’s studies on issues in public finance, Issue 1). p. 1.
[11] For a list of non-filers for 2023, see Office of the New York State Comptroller. (2024a). Not filed and inconclusive municipalities for Fiscal Stress Monitoring System Fiscal Years ending 2023. https://www.osc.ny.gov/files/local-government/fiscal-monitoring/2023/pdf/2023-munis-not-filed.pdf
Suggested citation:
Floss, F., Parshall, L., and Buonanno, L. (2025, April 2). “Local Government in New York State,” Governing New York State Through Crises Project.
About the authors
Fred Floss, PhD is a Professor of Economics and Finance at SUNY Buffalo State. Lisa Parshall, PhD, is Distinguished Professor of Political Science, Daemen University and a SUNY Rockefeller Institute of Government Fellow. Laurie Buonanno, PhD, is Professor of Public Administration in the Department of Economics & Finance.
