Frederick Floss (June 23, 2024)
Introduction
Comparing states is a particularly instructive (and ongoing) exercise in federal systems. The ability of governments to manage crises is intimately tied to revenues and expenses. But what is considered “the baseline” in New York State? How does NYS compare to other states? To what extent can NYS policymakers manage crises through expenditures and revenues? These are important questions because crises provide “opportunities” for politicians to attack the ways in which decision makers are attempting to deal with a crisis.
Expenditures
How a state spends its revenues depends on several factors including: size, demographics, federal mandates, weather, the tastes of its residents and expenditure history. Naturally, each state is unique, so the political and financial decisions they make will be different. There are many ways to look at and compare budgets. First, one might examine the main categories comprising the budget and how these categories relate to the total budget. Doing so controls for the expenditure amount, i.e., New York and California may be comparable but not New York and North Dakota. The Urban Institute (Urban Institute & Brookings Institution, nd), utilizing Census data, presents comparative data over time (1991-2021) in its Annual Survey of State and Local Government Finances. (The categories used by Census are somewhat different from the definitions used by New York so that the category values will not be identical in the analyses, above. Data before 1991 also is not directly comparable because of methodology changes.) Figure 5.10 includes the major categories of spending for 1991 and 2021 as a percentage of total expenditures, comparing NYS to the total expenditures of all other states and Figure 1 compares NYS with other states in these expenditure categories over time.
Figure 1 Comparative spending, NYS and All Other States, 1991 and 2021
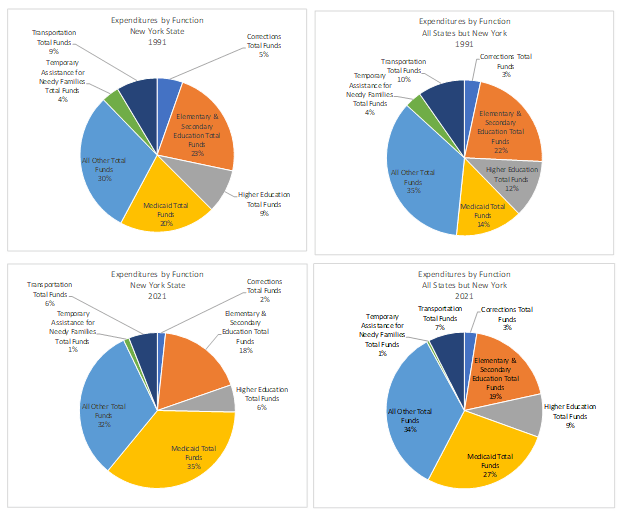
As Figure 1 illustrates, by 1991 New York was already spending six percent more on Medicaid than other states, was spending about the same on K-12 Education and three percent less on higher education. Over time Medicaid grew to 35 percent or 15 percent more of the budget while in the rest of the states, Medicaid grew to 27 percent. Both K-12 and Higher Education declined from 1991-2021, as did TANF. (Figure 2 compares NYS spending to other states from 1991-2021.)
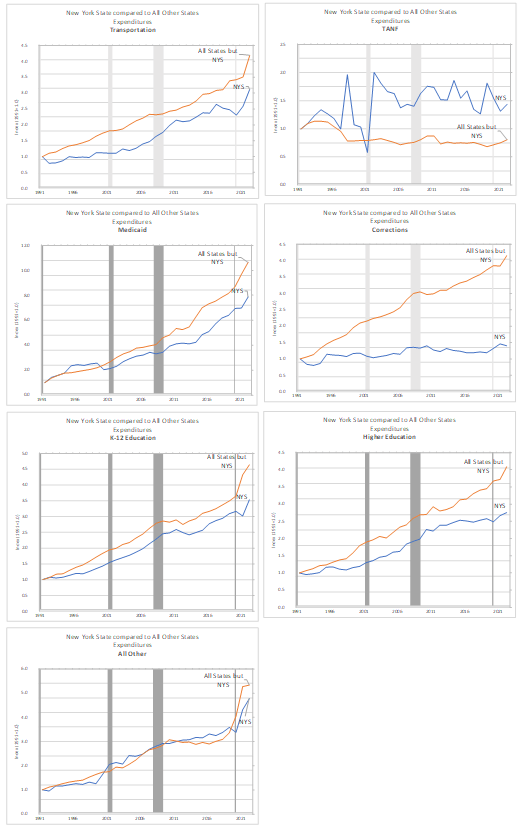
States have naturally increased Medicaid to receive the matching funds from the federal government. This became even more important with the American Care Act, which had a provision for expanded Medicaid. But what impact, if any, did 9/11, the Great Recession and COVID have on states’ budgets. As would be expected only Temporary Assistance for Needy Families (TANF) is impacted in New York by 9/11, where there is no impact to other states’ budgets. Medicaid and K-12 education follow a similar path to other states but seems to be diverging in corrections and higher education. The impact of federal COVID-19 and infrastructure aid to the states can be seen in the trends. As this one-time aid diminishes the question states will have to answer in 2024 and beyond is how to adjust their budgets. Will they revert to trend? Will Medicaid continue to become a larger part of the budget? These will be difficult decisions, especially considering balanced budget requirements.
Figure 2 New York’s Expenditures Compared to Other States, 1991-2021
Revenues
There are different ways to compare how states raise funds to meet the needs of their citizens. Due to differences in their economies, income level and politics, the types of taxes a state relies on changes from state to state. States will try to shift their tax burden away from their residents and onto others outside of their state. Florida will use sales taxes to “soak” tourists rather than resident and to lure pensioners from the Northeast and Midwest with the prospect of no state income tax. States with abundant natural resources will tax those since they can pass along the taxes to out of state consumers of these resources. New York has Wall Street and financial institutions where they can pass along fees and the salaries of their employees (nonresident PIT). These disparate approaches to generating revenues need to be considered when making state-by-state comparisons.
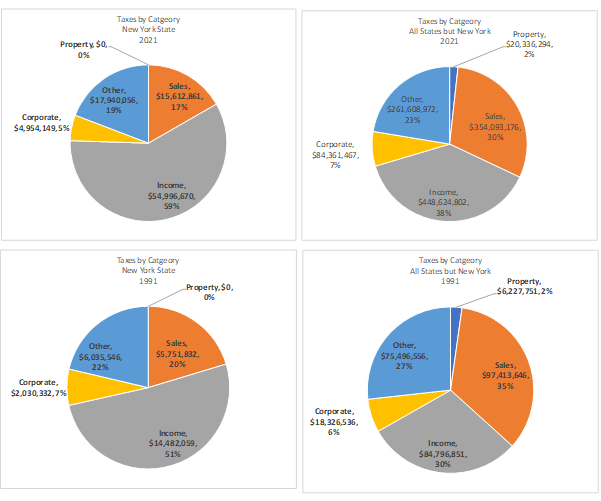
Figure 3 shows New York relying more on PITs as a percentage of revenue than other states and less on other taxes, particularly sales and property tax.[1] The pie charts also show that over time, all states (including NYS), are relying more on income taxes and less on sales tax. Corporate taxes became a smaller percentage in New York, while they increased in other states. As the rest of the country’s economies increasingly rely on corporate income, their tax rates have increased.
Figure 3 New York State Revenues Compared to Other States, 1991 and 2021
Which State has the highest tax rates?
Various “dueling” organizations rank states with respect to their taxes, but often for specific purposes such as demonstrating a state is less business friendly than another. These organizations are often highly partisan, and, therefore, the consumer of their data must exercise caution when reviewing the data. The Tax Foundation (nd), for example, publishes rankings and each year announces with great fanfare its “Tax Freedom Day,” – “the day when Americans have earned enough money to pay their total tax bill for the year.” The Center for Budget and Public Priorities (CBPP) (2019), however, claims the Tax Foundation “can leave a strikingly misleading impression of tax burdens.” Think tanks based in NYS such as the Manhattan Institute for Policy Research, Upstate United, and the Empire Center use these rankings to argue for lower PIT and corporate taxes. Table1 gives the rankings for New York State by major category and total taxes. The first point is that ranking systems weighing income taxes more heavily will raise New York’s rankings while those which have more equal weights will lower the ranking. Therefore, part of the reason for New York having a high ranking is the size of its economy.
Table 5.4 Tax Rankings, New York State (1991-2021)

Source: (Author’s calculations and Urban Institute & Brookings Institution, nd)
Another issue to consider is whether the rankings should be on nominal taxes, per capita taxes or should they be adjusted for personal income? (The Census Bureau reports data for all three measures.) Using nominal rankings, New York ranks the second highest in taxes – only California is higher – and its ranking has not changed over the last 30 years. But if one uses per-capita income and adjusted personal income as the basis for rankings, NYS’s taxes have dropped over the last 30 years; therefore, do nominal taxes fairly measure the tax burden on individuals?
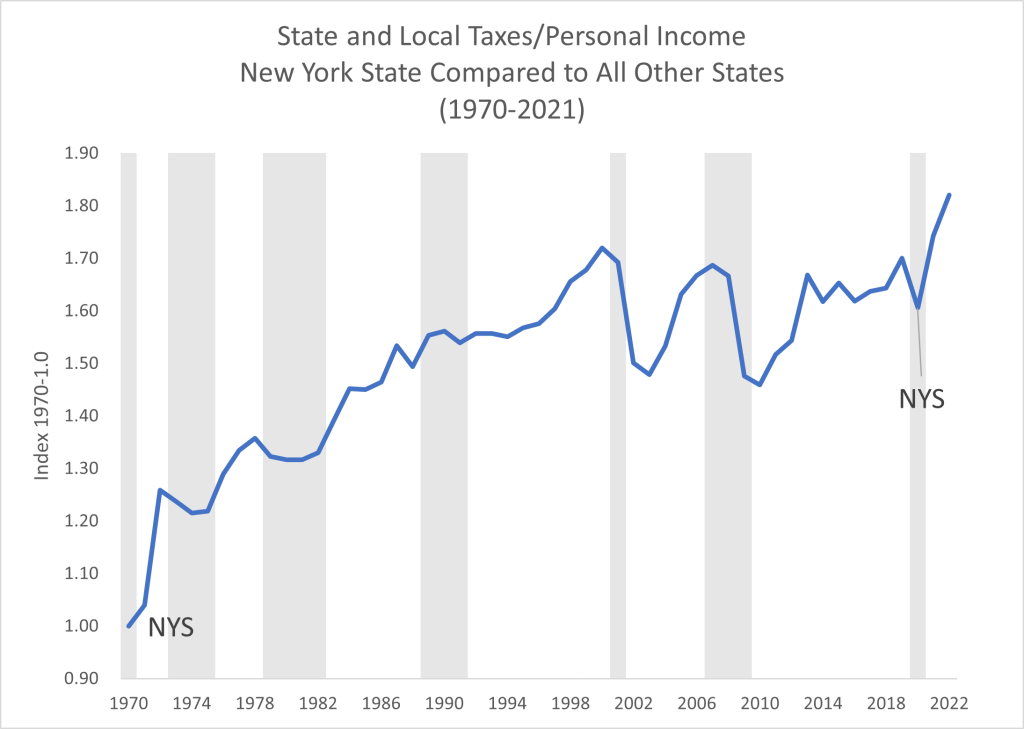
Finally, one can also compare taxes is to use the Bureau of Economic Analysis data on state and local taxes not just state taxes. Figure 4 charts the change in taxes from 1970 to 2021. Comparing New York to the rest of the states the trends are similar, but there are some important differences. After the 1975 NYC fiscal crisis, NYS’s state and local taxes increased faster than the rest of the country. After 9/11 taxes drop in the other states, but not in New York because the costs of the crisis are disproportionately carried by New York. Until the Great Recession, NYS’s taxes grew at a faster rate than the rest of the country, but since the recession New York is growing at the same rate as the rest of the country.
Figure 4 New York State Compared to Other States on Combined State and Local Taxes[2]
What conclusions can we draw? New York State still relies more heavily than other states on income taxes and less on sales taxes (which is a more progressive approach to taxation). Over time, the overall tax burden has dropped when taking population or personal income into account. When taking all the various ways of “ranking,” states by their tax burden, NYS likely does not deserve its “over taxed” state, but rather lines up about in the middle.
[1] New York tax structure is such that property taxes are used by localities and school districts. In most cases school taxes are larger than those levied by localities. Funding decisions for schools is partly a local decision and has led to issues of equity and lawsuits. See Chapter 10 in this volume.
[2] Source: BEA, SAINC50 Personal current taxes and authors calculations.
Works Cited
Marr, C., Bryant, K., & Huang, C.-C. (2019). Tax Foundation figures do not represent typical households’ tax burdens.
Tax Foundation. (nd). About Us. https://taxfoundation.org/about-us/
Urban Institute & Brookings Institution. (nd). State and local finance data. https://state-local-finance-data.taxpolicycenter.org/pages.cfm
Frederick Floss, Ph.D. is Professor of Economics & Finance, SUNY Buffalo State University.
Suggested Citation: Floss, F. (2024). “Tax Burden Comparison: New York State vs. Other States.” Governing New York State Through Crises Project. https://governingnewyork.com/essays/tax-burden-comparison-new-york-state-vs-other-states/
