June 6, 2025
Frederick G. Floss, Lisa Parshall, Laurie A. Buonanno, and Casey Jakubowski
Introduction
This essay focuses on the State’s efforts to fund its 690 school districts and to do so in an equitable manner. Naturally, any study of public education purporting to focus on funding must always recognize that fiscal challenges are inextricably linked to the State’s role in ensuring a measurable standard of education for all New Yorkers enrolled in P-12 public education (as well as students enrolled in charter, parochial, and most private schools and being home schooled). Therefore, the State is placed in the role as arbiter between urban and rural school districts, property poor and property rich school districts, teachers’ unions and school boards, State legislators and their constituents (and the latter further subdivided by parents with children in the public schools, parents with children in private or parochial schools, and taxpayers with no children or grown children).
The funding challenge for NYS’s budget over the past 50 years has been to balance New York’s increasing costs of social programs (especially Medicaid) with P-12 public education funding (Chakrabarti & Setren, 2011). The New York State Constitution directs the State Legislature to “provide for the maintenance and support of a system of free common schools, wherein all the children of this state may be educated.”[1]
The purpose of this essay is to lay out the revenues and cost involved in school district funding.
Background to New York State’s P-12 Education System
Every third Tuesday in May, voters across NYS are asked to vote on the board membership and budgets of New York’s independent school districts. While typically low turnout affairs, school district elections are of critical importance both because of the services provided and because significant tax expenditures are at stake. New York State spends more on public education, per pupil, than any other state.[2] To oversee the education system and all education activity within the state, the Board of Regents (BOR) was created in 1784 and operates under the State’s Education Law. Under the current structure, the BOR is composed of a minimum of 15 members, including one member per each of the 12 Judicial Districts, and four at-large members. Regents are vetted and appointed by a concurrent resolution of both chambers of the State Legislature and serve for five-year terms (staggered). Legislative appointment can be interpreted as a “major impediment to the governor’s ability to influence education policy in New York” (Pecorella and Duncombe 2012, 234). Yet, through their budgetary authority, agenda-setting and study-commission powers, governors exert significant influence on education policy and funding.
The BOR elects a Chancellor and Vice Chancellor and appoints a President of the University of State of New York (not to be confused with SUNY), who also serves as the Commissioner of Education—the chief administrative officer for the State Department of Education (SED). New York has two types of superintendents: district superintendents, who oversee a regional governance area, and local school district superintendents, responsible for a local school district system.[3] Through this high-level policy control, fiscal oversight, and the accountability requirements that are tied to State funding, NYS exercises considerable influence over all educational activities and retains authority to intervene when districts fall into controversy or crises.
Funding Costs, Sources, and Implications for School Equity
Costs
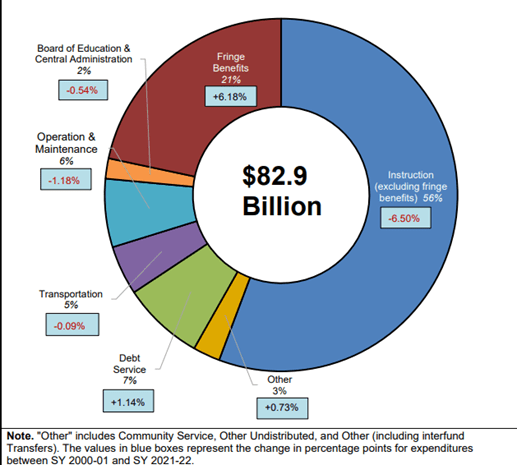
Figure 1 shows the change in the percentages spent in NYS’s major public school districts between the School Years 2000/2001 and 2021/2022. While instruction comprises nearly 60 percent of a district’s costs, this category has experienced a decrease of 6.5 percent of total costs in this period.[4]
Table 1 compares teacher salaries with average wages of the population in New York’s regions. This chart demonstrates why the much higher cost of living in Greater NYC needs to be considered in the public-school funding calculus.
Figure 1 Changes in Categories of Spending, Major School Districts in New York State (SY2001/2002 to SY 2021/2022 )
| Table 1 Salary Comparisons by Region for Teachers and All Workers in 2023 | ||||
| Region | Starting Wage (5% level) | Median Wage Teacher | Average Wage Population | Adjusted Wage Population for Masters |
| Capital Region | $49,610 | $72,086 | $61,287 | $90,705 |
| Central New York | $51,228 | $68,279 | $55,760 | $82,525 |
| Finger Lakes | $43,059 | $58,554 | $52,563 | $77,793 |
| Hudson Valley | $63,117 | $104,818 | $62,428 | $92,394 |
| Long Island | $62,845 | $119,025 | $71,866 | $106,361 |
| Mohawk Valley | $44,920 | $64,247 | $51,202 | $75,779 |
| New York City | $63,842 | $98,156 | $79,994 | $118,391 |
| North Country | $47,536 | $64,359 | $49,203 | $72,820 |
| Southern Tier | $46,793 | $63,386 | $60,950 | $90,206 |
| Western New York | $42,876 | $66,985 | $50,865 | $75,280 |
| Grand Total | $50,295 | $73,962 | $58,329 | $86,327 |
| Note: Adjustment 48% of Average Wage all workers, BLS CPS data. | ||||
Revenues
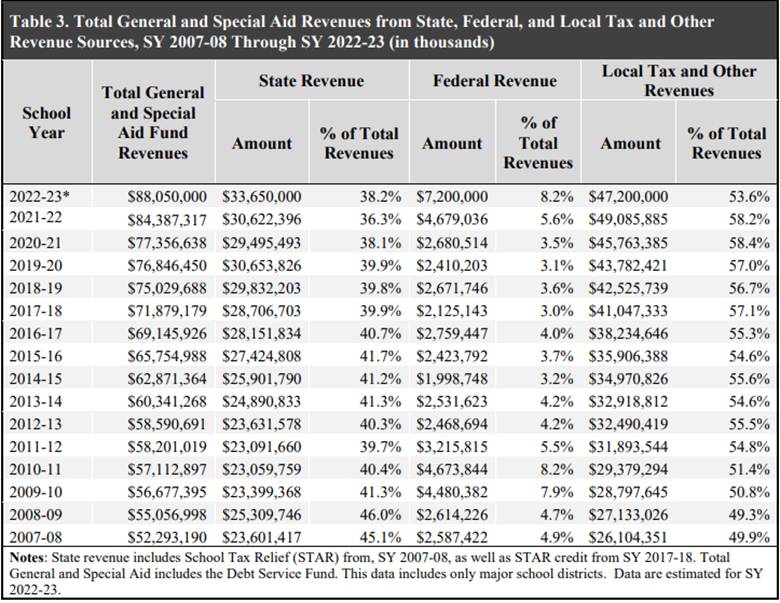
Although the exact mix varies by school district and from year to year, education funding comes from three primary sources: school (local) property taxes (58 percent), State formula aids and grants (36 to 39 percent), and federal sources (three to six percent) (New York State Education Department, 2023, p. 2). Federal monies have increased as a percentage of total revenue during recent national fiscal crises (the Great Recession, COVID-19).[5]
Table 2 Historic General and Special Aid Revenues from State, Federal, and Local Tax and Other Revenue Sources, SY 2007-08 Through SY 2022-23
The school property tax is levied by boards of education or municipal governments in the Big Five dependent city school districts (NYC, Yonkers, Buffalo, Rochester, Syracuse), which together educate 40 percent of New York’s students) on residential and commercial properties within the boundaries of each district (Chakrabarti & Setren, 2011, p. 17; New York State Education Department, 2023, p. 2). The Big Five are not permitted to raise school property taxes as suburban and rural districts do; instead, the State provides most of their school district funding, the percentage of which varies considerably by city. The city of Buffalo provides $71 million or 7.3% of the $972.5 million school budget. Buffalo’s contribution has not changed since the mid-2000s. Rochester provides $114 million or 16 percent of the budget, unchanged since 2007. Syracuse provides $67 million. In NYC, public education consumes more than one-third of the municipal budget. Yonkers is the only city other than New York which provided significant aid ($298 million of its SY 2023/24 $794 million school budget). The issue for the Big Five municipal budgets is once the school district base aid is raised, the State requires it to be continued permanently. This leaves the Big Five reluctant to commit additional funds in an uncertain budgetary future. At the same time, the SED has consistently linked poor academic performance in the Big Five to inadequate funding (Baker, 2018).
The second source of funding is from the State budget. State funding comes from three sources: the State General Fund (about 82 percent), the Special Revenue Fund (about 12 percent) (supported by lottery receipts), and the School Tax Relief (STAR) program (about seven percent). The State distributes aid three ways: flat grant per pupil (not equalized), wealth-equalized state aid per pupil (aid per pupil equalized in relation to district fiscal capacity) – Foundation Aid (discussed below)—is an example, and expenditure-based aid, which is calculated as a wealth equalized percentage of actual approved spending (transportation, building, BOCES) (New York State Education Department, 2023, p. 11).
STAR, implemented in 1998 during the George Pataki administration, was itself the result of demographic shifts. During the late 1940s-late 1970s when Baby Boomers were attending K-12, there were so many taxpayers with children and grandchildren attending public schools in their districts that most of the residents had stronger connection with the schools in their respective districts. After the Baby Boomers graduated from high school, however, there were fewer households with children and support for ever increasing school property taxes began to erode. This situation was not unique to NYS—indeed, it led to property tax revolts in many parts of the country, epitomized by California’s Proposition 13 capping property taxes and curtailing property assessments, which passed in 1978 by a 2 to 1 margin.
With Republicans back in Albany after 20 years of Democratic governorships, George Pataki proposed the STAR program, which provides State rebates to homeowners and the State, in turn, makes up this property tax loss to the school district. Moreover, because the reimbursements are based on relative property tax values and the reimbursement differs by property class, STAR provides wealthier districts with 40 percent greater funding in per pupil benefits than low-wealth districts (Orecki & Marcus, 2024).
The next State action taken to put a brake on property taxes was initiated by the Andrew Cuomo administration. Although the Property Tax Cap applies both to municipalities and school districts, it is important to keep in mind that school districts are more dependent on property taxes than are municipalities, deriving, on average 51.2 percent (FY 2022) of their revenues from real property taxes. [6] Put another way, sixty percent of total property taxes (county, city, town, village) are directed to the funding of public schools—sowing resentment among those property owners who do not derive personal benefits from the school district.[7]
School districts set and conduct public votes on their budgets after the completion of the State budget process. When State budgets are delayed, or when cuts to local assistance are threatened, it imposes great uncertainty and risk, especially for those school districts substantially reliant on State aid. Prior to public consideration, school districts are required to submit their proposed budgets to the NYSDTF, OSC, and the commissioner of education as part of the Property Tax Report Card. Property owners, especially on Long Island, have long complained about very high school property taxes. In 2004, 101 (or 15 percent) school budget increase requests failed on the first vote, but 79 passed on revote and five had contingency budgets, with most of these failures occurring on Long Island (NYSED 2005). An important caveat about reading too much into school budget rejections is that voter turnout for school budgets is very low. Often, when a budget is rejected, it is related to turnout—angry property owners, often those without children in the public schools or those who are sending their children to religious or private schools—turn out in higher numbers. When the budget is rejected, the school district makes cosmetic changes to the budget, while property owners favorable to the increase budget are motivated (and mobilized) to turn out to vote. While voter rejection certainly sends a message, the question is always “who is sending the message?” and are those voters sending the message representative of the majority view of the school district’s property owners? Based on Figure 2, we can report with some degree of confidence that school budget pass rates tend to decline during recessions. (The gray bars on the graph indicate recessions.) The one exception is in the late 1980s, which while the country was not in recession, this was a period of national tax revolts. Since 2007 (prior to implementation of the Property Tax Cap), the pass rates have been stable.
Figure 2 Percentage of NYS School District Budgets Adopted by Year (1969-2023)
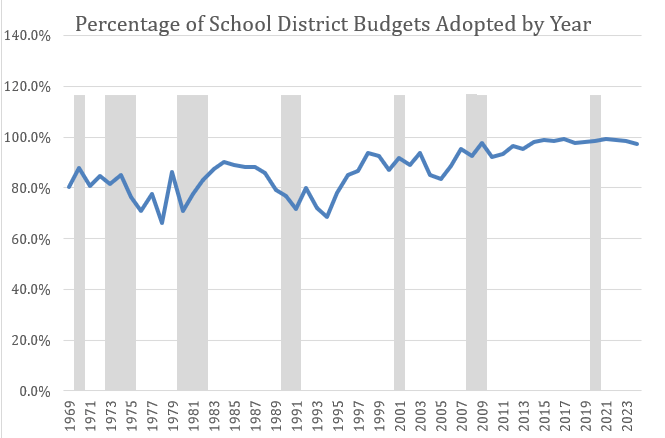
Figure 3 reports the number of districts that were seeking to override the Cap in their proposed budget (on planned or initial vote), with the post-2015 decline perhaps reflecting the Property Tax Freeze Credit, for which localities overriding the cap were not eligible (Office of the New York State Comptroller, 2015). During SY 2024/2025, of the 31 districts planning to override (out of over 600 districts), 16 (52 percent) had proposed budgets that included per pupil spending above the state average of $33,404.[8] (Failure at the polls resets the school district budget to prior year levels, thus foregoing even a marginal increase permitted under the Property Tax Cap. Importantly, however, the vast majority school budgets are approved on revote, the reasons for which we explain above.)
Figure 3 School District Property Tax Cap Override Votes (Initial or Planned Vote)
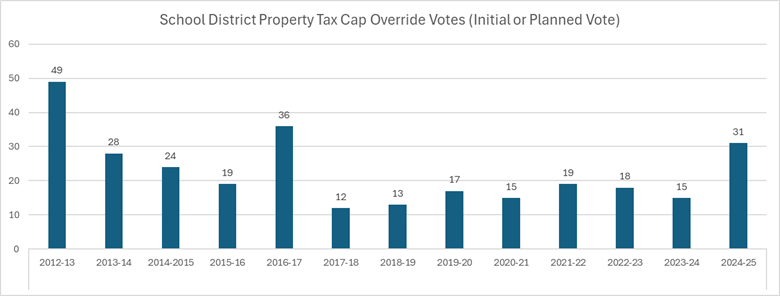
Data sources: NYSUT Fact Sheet 2021-2022 Property Tax Report Card and Empire Center _https://www.empirecenter.org/publications/school-budgets-outpace-inflation-as-districts-plan-to-spend-over-33k-per-student/)
According to Yinger (2012) the Property Tax Cap’s percentage-based restriction contributes to district disparities. The many years of inflation rates lower than two percent further squeezed revenue raising capacity of those districts trying to stay within the Cap. During the year 2022 was the first time since 2019 the cap was at two percent. Explain inflation rate – property tax cap was created during times of low inflation. Nguyen-Hoang and Zhang (2022, p. 23) found that within its first five years in effect, the Cap had the effect of constraining local district spending for those districts most reliant on property tax for funding.
Figure 4 Property Tax Cap compared to Inflation (2012-2024)
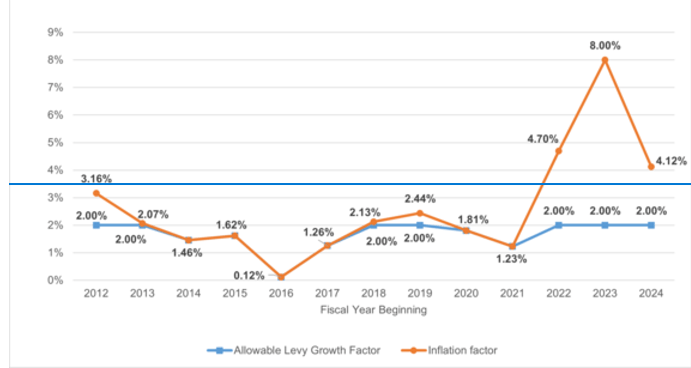
Source: Office of the New York State Comptroller
To fully grasp how NYS aid for P-12 works, it is important to recognize New York is an “equalizing State aid system,” meaning that State aid is distributed in “inverse proportion to fiscal capacity to offset dramatic differences in the ability of school districts to raise local revenues” (New York State Education Department, 2023, p. 3 & 11). But that is not the end of the story because over a century ago NYS adopted a compromise position that “equalizing” should not be accomplished by preventing wealthier school districts from raising more funds from property taxes, contrary to the position since taken by some other states that place limits on local funding.[9] In New York, because of the very large average wealth and income disparities between Upstate and Downstate (and, as with most states, between the suburban and the rural and urban districts), median real estate values are simply not comparable between Greater NYC and other parts of New York; for example, in Western New York the average home price is $174,834 as compared to $792,655 on Long Island. This translates into a wide gap in the average school tax levy by region—$63,157,631 for Long Island and $4,26,721 in Western New York. Therefore, it should be no surprise that higher expenditures per pupil are associated with higher actual property value per pupil. To put this into perspective, in 2022 “the average actual value of property per pupil among the lowest spending ten percent of districts was $383,309, while the average actual value per pupil among the highest spending ten percent of districts was $2,332,083, a difference of 508 percent (New York State Education Department, 2023, p. 3). These averages translate into tax revenue per pupil of $26,511 in the highest spending districts and $5,538 per pupil in the lowest spending district, even though the average tax burden is 14.52 per $1,000 in the lowest spending districts compared to 11.16 in the highest spending districts.[10] This disparity means that regardless of the two percent Property Tax Cap, property rich districts will continue to collect more taxes than school districts located in more modest regions as home assessments increase. Furthermore, referring to Table 1 (listing median teachers’ salaries and cost of living per NYS region) and Figure 1 (showing instruction costs comprise more than 50 percent of the school’s budget), Downstate school districts faces much higher teacher salary costs due to the higher standard of living costs as compared to Upstate school districts.
Regional disparity has been the underlying issue in debates over school funding, where those in property poor districts (rural New York) and in the Big Five dependent school districts (particularly NYC, which even while collecting substantial property taxes, faces heavy social service and public safety costs) argue the State should provide more funding to these disadvantaged districts to make up for the lower amount of funds available to schools in the city’s budget. Students in higher spending districts enjoy tutoring services, AP courses, SAT prep, music and art instruction, state-of-the-art computer labs, a full complement of varsity and intermural athletics, international baccalaureates—all advantages in gaining entrance to more elite universities. City school districts have attempted to even the playing field with magnet (high performing) elementary and secondary schools, but the competition is fierce for a limited number of seats; consequently, not all students with the potential to excel gain admission to these elite public schools. Of course, rural districts simply do not have the funds or enrollment to establish anything on the scale of the highly competitive magnet schools in New York’s larger cities.
In the 1970s almost 50 percent of the State’s expenditures went to education, but by the 2020s education accounted for just 25 percent of the budget.[11] An unintended consequence of the comparative decrease in State funding for P-12 was the Charter School movement, which took students out of the public schools in urban districts, reducing public school enrollment, and therefore State support.[12] The highly contested politics that culminated in adoption of The New York State Charter Schools Act of 1998 is important as a data point in our crisis approach because while associated with the State and the national Republican Party and carried forward by a Republican governor (George Pataki), the issue was complicated by previously nonexistent (as well as shifting) coalitions of parents, for profit and nonprofit corporations, religious schools, teachers’ unions, and community activists. Charter Schools were supposed to solve the problems of educational inequities, especially between urban and suburban schools. Charter schools have filled a gap for some families and students, but they have not solved the problem of New York’s many underfunded and underperforming public schools. In fact, they have worsened the problem for public schools because of the loss of State funding for every student who enters the Charter School. (The most recent attempt by NYS to address this chronic problem, Foundation Aid, will be considered later in this chapter.) The upshot is that poorer districts think more State funding should be redirected to their schools and better off school districts do not want State cuts (which would then entail higher school property taxes to maintain current school programming and teacher-student ratios). This dilemma continues to be the most important fiscal battle over the State’s involvement in funding public education.
The third funding stream, federal assistance, typically averages around three to four percent (the figure was six percent for fiscal year 2023 due to COVID-19 pandemic funds. (See Table 2 for the average federal percentage contribution from 2007-2023.) Of course string are attached to those federal monies allocated during non-crisis years. Sometimes these “strings” are highly contested (as were the assessment rubrics and federal control over determination of standards required to participate in George W. Bush’s “No Child Left Behind” initiative). Nevertheless, federal funding is a critical revenue component for many school districts.[13]
School Districts and Enrollments
New York State’s P-12 education system is made up of 690 school districts—NYC’s is the largest, Raquette Lake’s (located in the North Country) is the smallest.[14] Outmigration and demographic shifts during the past 50 years, as illustrated in Table 3, have impacted New York’s regions. During the decade of the 1970s NYS’s average enrollment was 3.5 million students at the height of the baby boom. By the 1980s average enrollment dropped to 2.5 million only again to see enrollments rise to 2.9 million in the 1990s. Such unpredictable enrollment creates difficulties in planning and finances.
Table 3 New York State P-12 Enrollments by Region
| P-12 Enrollment by Region, NYS | ||||||
| Percent Change | ||||||
| 1976 | 2021 | 2022 | 2023 | (76-23) | (21-23) | |
| Capital Region | 188,278 | 136,832 | 135,843 | 135,023 | -28.3% | -1.3% |
| Central New York | 166,113 | 104,934 | 103,627 | 102,914 | -38.0% | -1.9% |
| Finger Lakes | 234,354 | 156,584 | 154,409 | 152,991 | -34.7% | -2.3% |
| Hudson Valley | 384,853 | 314,639 | 311,112 | 310,291 | -19.4% | -1.4% |
| Long Island | 597,216 | 418,257 | 414,657 | 414,094 | -30.7% | -1.0% |
| Mohawk Valley | 109,864 | 63,867 | 63,483 | 63,226 | -42.5% | -1.0% |
| New York City | 1,074,278 | 1,989,573 | 1,889,927 | 1,848,806 | 72.1% | -7.1% |
| North Country | 90,365 | 53,854 | 54,155 | 54,031 | -40.2% | 0.3% |
| Southern Tier | 147,890 | 77,286 | 76,585 | 76,327 | -48.4% | -1.2% |
| Western New York | 306,652 | 179,110 | 177,228 | 176,479 | -42.4% | -1.5% |
| Grand Total | 3,299,863 | 3,494,936 | 3,381,026 | 3,334,182 | 1.0% | -4.6% |
Conclusion
Within communities, public schools serve to promote social cohesion through community identity and activities that extend beyond the classroom in the form of sporting and cultural events, and as venues for civic life (as polling and meeting places). The upshot is that schools (local service providers) are subject to a host of external pressures, enhanced expectations, and an increased cost of operations while managing budgetary constraints within a system of variable State aid and federal assistance.
References
Baker, B. D. (2018). Educational inequality and school finance: Why money matters for America’s students. Harvard University Press.
Chakrabarti, R., & Setren, E. (2011). How did the Great Recession affect New York State’s public schools? Federal Reserve Bank of New York: Staff Reportss. https://www.newyorkfed.org/research/staff_reports/sr534.html
New York State Education Department. (2023). State aid to schools: A primer. https://www.nysed.gov/sites/default/files/programs/fiscal-analysis-research/primer-2023.pdf
New York State Legislature. (1925). Report from the Special Joint Committee on Taxation and Retrenchment of the Legislature of the State of New York, January 15.
Nguyen-Hoang, P., & Zhang, P. (2022). Cap and Gap: The fiscal effects of property tax levy limits in New York. Education and Finance Policy 17(1), 1-26.
Office of the New York State Comptroller. (2015). Three years of the tax cap – Impact on school districts.
Orecki, P., & Marcus, S. (2024). Target and tighten: The sustainable path for school aid growth in New York – Citizens Budget Commission of New York.
Singer, A. (1999). American apartheid: Race and the politics of school finance on Long Island, NY. Equity & Excellence,, 32(3), 25-36.
Yinger, J. (2012). Four flaws In New York State’s property taxes and how to fix them: Levy limits. It’s elementary http://cpr.maxwell.syr.edu/efap/about_efap/ie/June12.pdf.
[1] New York State Constitution Art. XI, §1 (Formerly Art. IX, §1, renumbered by Constitutional Convention of 1938 and approved by vote of the people November 8, 1938.) The Common School Act of 1812 established the creation of school districts which, by 1843, numbered 10,769 (Justice 2005, 1262).
[2] According to the U.S. Census Bureau, NYS ranked first in per pupil spending in 2021, 2022, and 2023. https://www.census.gov/library/visualizations/interactive/how-did-covid-19-affect-school-finances.html. In 2023, the figure was $29,873. The FYE 2024 Executive Budget Briefing Book reported that NYS ranked first in per pupil expenditures for sixteen straight years.
[3] The 37 District Superintendents work with local school district superintendents and boards, supervise specialized (career and technical education) programs, and special education programs and support services.
[4] In NYS, public school teachers must have a master’s degree to obtain permanent certification, with salaries in New York’s public schools comparable to other professions in which a master’s degree is required. Median and average (mean) wage calculations depend on several issues and care must be taken. If teachers are older, for example, one would expect their wages to be higher. If a region has more service industry workers, the population wage will be lower, and teachers’ salaries will be above the median.
[5] Give percentages for the Great Recession and COVID-19.
[6] The Big Five dependent school districts are exempt from the Property Tax Cap.
[7] Five counties share a portion of their sales tax with school districts and the 57 small city school districts are permitted to collect a utility tax (half of them do). See New York State Education Department. (2023). State aid to schools: A primer. https://www.nysed.gov/sites/default/files/programs/fiscal-analysis-research/primer-2023.pdf, pp.2-3.
[8] Top-ranked in per pupil spending was Kiryas Joel (Orange County) with a proposed budget of $217,114.01 per pupil. See https://www.newyorkupstate.com/schools/2024/05/planned-per-pupil-spending-in-ny-school-districts-ranked-1-to-668.html
[9] This is an excerpt from a 1925 Report issued by the New York State Legislature:
It may be accepted as a principle of democracy that the education of its youth is the duty and responsibility of the State; that the State should make available for every child a satisfactory educational opportunity; and that the cost of this satisfactory minimum should fall equitably upon the taxpayers of the State. [But it is also] understood that the application of this principle should in no case bar any community from providing an educational program more extensive than the accepted state-wide minimum program.
New York State Legislature. (1925). Report from the Special Joint Committee on Taxation and Retrenchment of the Legislature of the State of New York, January 15. (p. 21)
[10] It is important to remember that not all Long Island school districts are fabulously wealthy. Nassau County’s Hempstead, Roosevelt, and Wyandanch have had a history of being significantly underfunded. See, for example, Singer, A. (1999). American apartheid: Race and the politics of school finance on Long Island, NY. Equity & Excellence,, 32(3), 25-36. .
[11] This does not mean spending by the state went down, only it grew less slowly than other categories.
[12] Charter Schools are technically public schools run by a private entity. Initially, they were thought of as pilot programs to try new innovative techniques to teaching. Some have been successful others have closed. But in either case, school districts pay a per pupil allocation.
[13] New York State ranks 51st in the percentage of aid from the federal government; Mississippi ranks first, with 23 percent of its school aid provided by the federal government. Source: 2022 Census of Governments: Finance – Survey of School System Finances.
[14] There are also seven school districts operating under special law that lack independent authority. These districts do not levy taxes and issue debt.
Suggested citation:
Floss, F., Parshall, L., Buonanno, L., and Jakubowski, C. (2025, June 6). “School District Funding in New York State,” Governing New York State Through Crises Project. https://governingnewyork.com/school-district-funding-in-new-york-state/
About the authors
Fred Floss, PhD is a Professor of Economics and Finance at SUNY Buffalo State. Laurie Buonanno, PhD, is Professor of Public Administration in the Department of Economics & Finance. Lisa Parshall, PhD, is Distinguished Professor of Political Science, Daemen University and a SUNY Rockefeller Institute of Government Fellow. Casey Jakubowski, PhD, is an adjunct lecturer in SUNY.
