New York State’s Universal Pre-Kindergarten (UPK) program traces its origins to federal War on Poverty initiatives of 1965 and the landmark 1998 Pataki budget and today serves more than 190,000 children annually through approximately $1.2 billion in combined state and federal funding. Governor Kathy Hochul’s 2026–2027 executive budget proposes achieving universal full-day pre-K for all four-year-olds by the 2028–2029 school year, with per-pupil state reimbursement rising to at least $10,000. A 3-K pilot expansion simultaneously targets childcare deserts in Broome, Monroe, and Dutchess counties. This report analyzes the demographic context—approximately 450,000 three- and four-year-olds statewide, a population in gradual decline—and maps geographic access gaps, with an estimated 58% of census tracts classified as childcare deserts. Economic modeling projects universal pre-K for four-year-olds will generate between $260 million and $1.2 billion in annual statewide GDP impact, while caregivers who exit the workforce due to childcare unavailability face estimated lifetime financial costs of $555,000 to $758,000. Significant implementation challenges continue, including a 30% certified teacher shortage, 49 districts that opted out of UPK participation, persistent rural capacity gaps, and projected federal funding reductions of $7.8 billion. Governor Hochul’s proposal is a critical step toward closing persistent equity and access gaps in early childhood education across New York State.
Keywords: universal prekindergarten, New York State, childcare deserts, Hochul budget, early childhood education, economic impact, workforce participation
Introduction
Universal pre-K for 3–4-year-olds has a long and complicated history, starting in 1965 with the War on Poverty programs of the Johnson Administration, and in the context of pre-k, the Head Start program. Head Start is designed to help children living in poverty prepare for school and “catch up” with their more affluent peers. The most studied early childhood education program is the Ypsilanti, Michigan High/Scope Perry Preschool Program, which ran from 1962–67. Set up as a randomized assignment study, a longitudinal panel study has followed individuals in both the control (no pre-school) and treatment group (pre-school) from age 3 to 11 and again at ages 14, 15, 19, 27, and 40. These longitudinal studies of the Perry Preschool Project have shown substantial socioeconomic benefits, including higher wages, lower unemployment, and reduced incarceration rates for preschool participants. At the same time, many studies of Head Start programs have identified “fade-out”: the initial improvements in reading and math scores from Head Start participation diminish during the first few years of elementary school. These diverse findings highlight a familiar policy challenge: balancing short-term costs against long-term benefits and broader positive externalities. There were also questions raised in these studies if the results held for middle- and upper-class families—i.e. are these programs scalable? These conflicting findings have made it difficult to achieve consensus in a political environment. This is the political context Governor Hochul faced when she proposed an expansion of pre-K programming in New York State.
In this background New York has a checkered history. Childcare funding comes from numerous federal, state, local and not-for-profit sources. Adding to NYS’s budgetary challenge has been that temporary COVID-19 funding was set to be phased out, requiring the State to seek new sources to fund early childhood education.
The Fiscal Policy Institute (FPI) points out:
“New York’s CCAP is part of the federal Child Care Development Fund (CCDF) program. New York’s program is regulated by the Federal and State governments, administered by local governments across the State, and funded jointly by the federal, state, and local governments. The federal CCDF distributes funds to states, which supplement those grants with state funding before suballocating them to localities. In fiscal year 2024, the federal government’s Child Care Development Block Grant (CCDBG) distributed $11.3 billion to state CCDF programs. New York’s share of this funding was $607.9 million. Further, the State shifts a part of its Federal Temporary Assistance for Needy Families (TANF) grant to its childcare program. For fiscal year 2025, the State shifted $464 million of these funds.” – the Fiscal Policy Institute
Early History in New York State
New York State began discussing early childhood education in 1985, when the Board of Regents issued its “Learning Begins with Birth” statement. That effort encouraged school districts such as New York City, Buffalo, and Rochester to launch small programs using federal Title I and Head Start funding. A statewide pilot UPK program did not begin until Governor Mario Cuomo’s 1990 budget. By 1995, New York City was using local funds to supplement state and federal UPK support. In 1998, Governor Pataki’s budget provided $100 million per year for five years in competitive UPK grants. By the early 2000s, New York States’s Pre-K investment was growing faster than the national average, but after COVID-19 the state fell behind. Figure 1 compares New York with the average of other states and shows three distinct periods: flat state funding until 2014, faster growth than the rest of the country from 2014 until COVID-19, and relative decline afterward. Table 1 shows the same pattern in per-child spending: New York remained above the national average through 2020, then fell below it by 2022.
Figure 1: NYS Pre-K Per-Child Spending vs. National Average, SY 2013–14 through SY 2024–25.
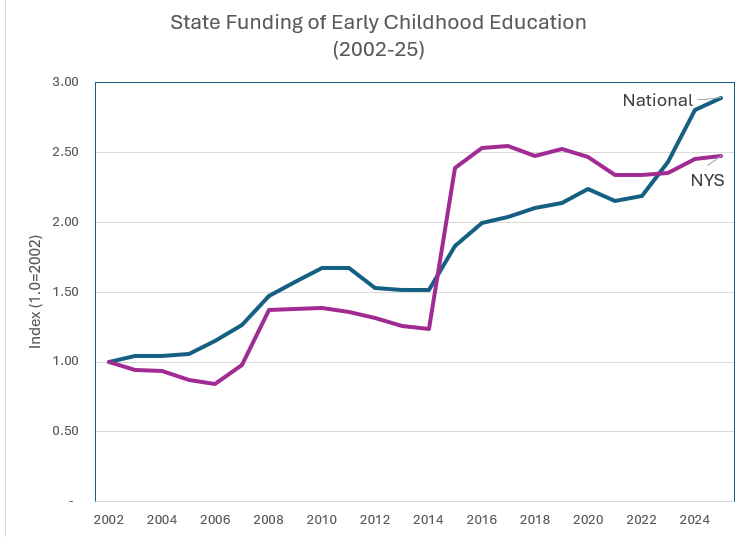
Data source: NIEER State Preschool Yearbooks 2014–2025.
Note. Three distinct periods are visible: flat NYS funding compared to national growth through SY 2013–14; rapid NYS growth outpacing the national average from SY 2014–15 through SY 2019–20; and relative NYS decline following the COVID-19 pandemic. Data derived from National Institute for Early Education Research (NIEER) State Preschool Yearbooks (2014–2025).
Table 1: New York State Versus National Average Pre-K Per-Child Spending, School Years 2013–2014 Through 2024–2025
| Year | School Year | NYS Per-Child ($) | National Avg ($) | NYS vs. Nat’l Gap ($) | Policy Event |
| 2014 | SY 2013–14 | $5,800 | $4,133 | $1,667 | NYC Pre-K for All pre-launch; NYC UPK announced under de Blasio |
| 2015 | SY 2014–15 | $7,700 | $4,489 | $3,211 | NYC launches universal pre-K; NYS drives 2/3 of national spending increase |
| 2016 | SY 2015–16 | $8,100 | $4,706 | $3,394 | NYC UPK scales to ~70,000 children; statewide expansion accelerates |
| 2017 | SY 2016–17 | $8,300 | $5,008 | $3,292 | NYS supports high per-child investment; PDG grants bolster other states |
| 2018 | SY 2017–18 | $8,500 | $5,100 | $3,400 | Steady UPK allocations; NYS among top states in per-child resources |
| 2019 | SY 2018–19 | $8,671 | $5,239 | $3,432 | UPK allocations increase; NYS peak premium over national avg era |
| 2020 | SY 2019–20 | $8,835 | $5,374 | $3,461 | Final pre-COVID year; NYS at relative spending peak vs. national avg |
| 2021 | SY 2020–21 | $7,900 | $6,200 | $1,700 | COVID-19: Enrollment collapse; fixed costs over fewer children distort figures |
| 2022 | SY 2021–22 | $6,205 | $6,621 | ($416) | Post-COVID rebound; federal ESSER/ARP funds boost other states’ per-child figures |
| 2023 | SY 2022–23 | $6,101 | $7,200 | ($1,099) | NYS spending $884M; including $64.4M federal recovery funds; 155,512 enrolled |
| 2024 | SY 2023–24 | $6,285 | $7,888 | ($1,603) | NYS spending $940M+; includes $58M federal recovery; ~159,000 enrolled |
| 2025 | SY 2024–25 | $7,273 | $8,300 | ($1,027) | NYS budgets $1.2B for UPK; enrollment ~165,000 est.; trend recovery underway |
| Change 2014→2025 | — | $1,473 | $4,167 | ($2,692) | — |
Note. NYS per child figures include state and federal pre-K allocations divided by reported enrollment. National average figures are from National Institute for Early Education Research (NIEER) State Preschool Yearbooks (2014–2025). Parentheses show NYS spending below the national average. COVID-19 enrollment disruptions affect SY 2020–21 per-child calculations.
Current Proposal
The current budget’s UPK proposal brings New York back above the national average.
“Governor Hochul’s executive budget proposed providing added support to ensure truly universal full-day pre-K for all four-year-olds in the State by the start of SY 2029. The Executive Budget provides added funding to support universal four-year-old pre-K, increasing districts’ per-pupil funding to the higher of $10,000 or their current selected Foundation Aid per pupil. Additionally, the Budget increases funding to New York City’s prekindergarten program for three-year-olds (“3-K”) by $205 million to support universal access. In total, Universal Prekindergarten Aid in SY 2027 is estimated to increase by $561 million (52.5 percent) over SY 2026 levels, including expected added aid to school districts expanding their programs to serve more four-year-olds.” – Education| Briefing Book | NYS FY 2027 Executive Budget
The state legislature supported the Governor’s proposal in the enacted budget:
“Child Care Expansion. The Enacted Budget includes actions to make childcare more affordable. These actions include increasing existing subsidies, expanding universal pre-K statewide, supporting a 3-K expansion in NYC, and establishing a 2-Care NYC program. In addition, childcare pilot programs are created in select counties, as well as new friendly zoning initiatives to increase childcare capacity.” – NYS State Legislature
The legislature’s main concern with the Governor’s proposal during negotiations was whether more upstate counties should be included in the 3-K pilot. Ultimately, the Governor’s proposal remained unchanged, and funding was limited to the original three counties (Broome, Dutchess, Monroe). Together, these counties stood for a range of demographic profiles. Table 2 gives the demographic profiles and why the three original counties were chosen. It is important to see the current budget as a starting point to a universal pre-K program which includes all 3- and 4-year-olds in full day programs, primarily run by school districts.
Table 2: Demographic Profiles of Three-K Pilot Counties
| Category | Broome County | Monroe County | Dutchess County |
| Region | Southern Tier | Finger Lakes | Mid-Hudson |
| Population | ~198K | ~760K | ~300K |
| Children 0–5 | ~10.5K | ~40K | ~14K |
| Child Care Desert Status | High — majority of tracts | Moderate — urban & suburban pockets | High — outside Poughkeepsie |
| Median Household Income | ~$57K | ~$68K | ~$89K |
| Infant Care Cost | ~$12K/yr | ~$15K/yr | ~$17K/yr |
| Toddler Care Cost | ~$11K/yr | ~$14K/yr | ~$16K/yr |
| % Income Spent on Infant Care | ~21% | ~22% | ~19% |
| Workforce Shortage Severity | Severe | Severe | High |
| Existing Pre-K Infrastructure | Moderate | Strong (Rochester UPK) | Moderate |
| Pilot Rationale | Rural-urban mix; high-poverty | Scalable metro model | High-cost region; suburban gaps |
Note. Data derived from U.S. Census Bureau American Community Survey 5-Year Estimates (2019–2023) and New York State Office of Children and Family Services (OCFS, 2024). Childcare desert status reflects OCFS analysis of licensed childcare slot availability compared to the child population aged 0–5.
Demographics
There are 450,000 3- and 4-year-olds in New York State and while this population is declining, it has stayed about 10 percent of the total number of households. (See Table 3.)
Table 3: The Total Number of 3- and 4-Year-Olds by Region
| Region | 2010 | 2015 | 2020 | 2021 | 2022 | 2023 | 2024 | Percent Change |
| Capital Region | 24,343 | 22,967 | 22,350 | 22,629 | 22,391 | 22,703 | 21,877 | −10.1% |
| Central New York | 17,893 | 17,457 | 17,052 | 17,063 | 16,829 | 17,021 | 16,683 | −6.8% |
| Finger Lakes | 27,076 | 28,250 | 27,957 | 27,848 | 27,203 | 27,580 | 26,441 | −2.3% |
| Hudson Valley | 57,594 | 57,468 | 59,041 | 58,837 | 59,502 | 59,841 | 59,290 | +2.9% |
| Long Island | 69,681 | 67,304 | 64,767 | 64,549 | 62,353 | 63,279 | 63,536 | −8.8% |
| Mohawk Valley | 11,941 | 11,537 | 10,422 | 10,318 | 10,329 | 10,517 | 9,946 | −16.7% |
| New York City | 202,234 | 223,607 | 214,914 | 218,869 | 212,350 | 202,152 | 199,736 | −1.2% |
| North Country | 10,064 | 10,730 | 9,767 | 9,836 | 9,548 | 9,548 | 9,322 | −7.4% |
| Southern Tier | 14,120 | 13,693 | 13,938 | 13,754 | 13,134 | 12,780 | 12,554 | −11.1% |
| Western New York | 31,708 | 30,256 | 30,826 | 30,961 | 29,883 | 30,580 | 30,108 | −5.0% |
| Grand Total | 466,654 | 483,269 | 471,034 | 474,664 | 463,522 | 456,001 | 449,493 | −3.7% |
Note. Population figures are estimates derived from U.S. Census Bureau American Community Survey and Decennial Census data. Percent change calculated from 2010 to 2024. Regions follow New York State Economic Development regional designations.
About half of New York State’s three- and four-year-olds live in New York City, which has experienced the smallest decline in this age group since 2010. However, smaller regions continue to face childcare deserts. OCFS estimates that more than 58% of census tracts statewide are childcare deserts. In New York City, an estimated 57% of census tracts meet this definition, while rates in large upstate counties are generally around 60%.
Figure 2: Map: New York State Childcare Desert Census Tract Map.
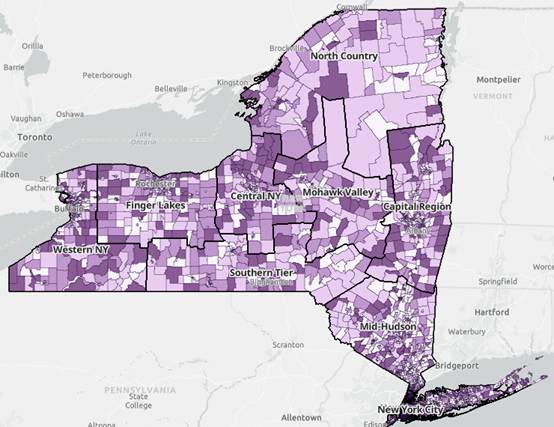
Note. Darker (purple) shading shows census tracts with the highest concentration of childcare desert conditions, defined as fewer than one licensed childcare slot per two children under age 5. Data sourced from New York State Office of Children and Family Services (OCFS, 2024).
In Figure 2, the darker tracts are in the purple and show more need. Along with access, there is also the question of affordability, the twin problems which the state must combat. While there is a need for funding it is estimated that there is a 30% shortage of certified teachers and aides. There is also a decline in the number of students going into early education in colleges and universities. The fundamental reason for the lack of pre-K teachers is the low pay, with salaries close to the minimum wage.
Economic Impact of Child Care
A lack of affordable childcare can affect young families for years and may create intergenerational costs. The Perry Preschool Project, which followed participants for more than 40 years, found long-term economic benefits for children. Although these outcomes support investment in high-quality pre-K, the more immediate benefit is helping caregivers, especially women, return to the workforce sooner. For one child, daycare and related after-school costs can reach $55,000 per year. For many low-income women, these costs exceed potential earnings, making it financially rational to leave the workforce until their children attend school full time.
Governor Hochul’s proposal to make pre-K universal for four-year-olds by 2029 would help caregivers return to work sooner and reduce the long-term financial costs of workforce exits. Table 4 summarizes the estimated costs for an average New York family.
Table 4: Estimated Lifetime Financial Costs of a Five-Year Workforce Exit Due to Childcare Unavailability
| Category | Mechanism | NYS Estimate (5-Year Workforce Exit) | Notes |
| Direct Lost Wages | No earnings during exit | $301,500 | $60,300 × 5 years (no raises) |
| Lost Wage Growth | Missed raises, promotions | $47,000–$62,000 | Based on 3% annual rises + slower post-return trajectory |
| Retirement Contributions Lost | No employee or employer contributions | $45,000–$70,000 | Includes compounding to age 65 |
| Reduced Social Security Benefits | 5 “zero years” lower AIME | $12,000–$25,000 lifetime | Based on SSA calculators |
| Post-Return Wage Penalty | Permanent downward shift in earnings path | $150,000–$300,000 | Based on Census “motherhood penalty” trajectory |
| Total Lifetime Cost | Sum of above | $555,000–$758,000 | Estimate |
Note. Estimates reflect average outcomes for a New York State caregiver earning approximately $60,300 annually (New York State median individual earnings, U.S. Census Bureau, 2023). Social Security benefit reduction based on Social Security Administration Average Indexed Monthly Earnings (AIME) method. Post-return wage penalty modeled on Kleven et al. (2019) child penalty framework.
These effects also extend to the state economy. Table 5 presents assumptions for low, central, and high scenarios, which are then used to estimate the proposal’s effects on state GDP and tax revenue. These figures represent the annual benefits of universal pre-K for four-year-olds under the Governor’s proposal. If three-year-olds were included, the benefits would likely be substantially larger. Table 6 presents these estimated economic impacts.
Table 5: Estimated Parental Labor Supply Effects and Economic Impact Assumptions
| Category | Low Scenario | Central Scenario | High Scenario |
| 4-year-olds served statewide | 200,000 | 220,000 | 230,000 |
| Labor force participation (LFP) increases for mothers of 4-year-olds | +3 p.p. | +5 p.p. | +7 p.p. |
| More parents entering work | 6,000 | 11,000 | 16,000 |
| Average annual earnings per new worker | $35,000 | $40,000 | $50,000 |
Note. Labor force participation elasticity estimates are based on Cascio and Schanzenbach (2013) and Gelbach (2002) studies of universal preschool effects on maternal employment. Earnings figures reflect New York State wage distribution for part- and full-time workers re-entering the labor force (New York State Department of Labor, 2024). p.p. = percentage points.
The program’s benefits extend beyond individual families through broader multiplier effects. When parents return to work, their additional income supports household spending and contributes to local economic activity. The additional income has the added effect of raising state and local tax revenues- the estimates of effective rates include income, property and sales taxes. The estimates do not account for potential outmigration by families who leave New York for lower-cost areas because they cannot afford either to remain out of the workforce or to pay for childcare. More income and property tax revenue may also help offset costs school districts incur when expanding pre-K programs.
Table 6: Statewide Economic Impact of Universal Pre-K for Four-Year-Olds
| Category | Low Scenario | Central Scenario | High Scenario |
| New annual labor income | $210M | $440M | $800M |
| Regional economic multiplier | 1.25 | 1.35 | 1.50 |
| Total GDP impact | $260M | $600M | $1.2B |
| Effective state + local tax rate | 9% | 11% | 12% |
| New annual tax revenue | $23M | $66M | $144M |
Note. GDP impact calculated by applying regional economic multipliers to estimated new annual labor income. Multiplier values are consistent with Bureau of Economic Analysis Regional Input-Output Modeling System (RIMS II) estimates for New York State service industries. Tax revenue estimates assume no behavioral offsets. Figures stand for annual steady-state impacts once universal enrollment is achieved.
Expanding New York State’s program for three- and four-year-olds would move the state closer to models used in parts of Europe, where broad public childcare support helps parents, particularly women, return to work sooner and improves work-life balance compared with typical childcare arrangements in the United States.
Conclusion
New York State’s Universal Pre-Kindergarten (UPK) program has been a cornerstone of early childhood education policy since its launch in 1998. Today, it serves more than 190,000 children annually through approximately $1.2 billion in combined state and federal funding. Despite decades of investment, true universality remains out of reach: statewide, about 75% of eligible four-year-olds are enrolled, leaving an estimated 40,000 children without a publicly funded pre-K seat.
In January 2026, Governor Kathy Hochul introduced a landmark proposal to close this gap by requiring universal access for all four-year-olds by the 2028–2029 school year and nearly doubling the minimum state reimbursement rate. The state legislature endorsed the plan in March 2026, and the enacted SFY 2026–2027 budget, signed into law in late May 2026, preserved the core UPK expansion provisions.
Significant implementation challenges remain. Suburban districts across the state are caught in a funding “middle ground”: too affluent to qualify for the highest state reimbursement rates, yet unable to fully cover pre-K costs through local budgets. Rural upstate regions, including the Southern Tier, Mohawk Valley, and North Country, face overlapping pressures as declining school-age populations reduce enrollment while staffing shortages and aging facilities limit expansion capacity. In addition, 49 districts opted out entirely in 2024–2025, primarily small rural districts where the current reimbursement rate does not cover basic program costs. Expanding teacher certification pipelines will be essential to building an adequate workforce of qualified educators. At the same time, projected federal cuts to education and health care, estimated at more than $7.8 billion, could increase financial pressure on both state and local governments.
For lower- and middle-income families with young children, childcare remains a major affordability challenge, compounding pressures from housing costs and inflation. Although the state has limited ability to affect inflation directly, its efforts on housing and childcare address two major drivers of household financial strain. Table 3 shows that nearly 450,000 three- and four-year-olds could benefit from expanded UPK access, underscoring the continued need for investment. Despite obstacles at both the school district and state levels, the 2026–2027 budget represents a crucial step toward a more universal, fair, and economically beneficial early childhood education system in New York.
References
Cascio, E. U., & Schanzenbach, D. W. (2013). The impacts of expanding access to high-quality preschool education. Brookings Papers on Economic Activity, 2013(2), 127–192. https://doi.org/10.1353/eca.2013.0012
Child Care Aware of America. (2023). Demanding change: Repairing our childcare system. https://www.childcareaware.org
Fiscal Policy Institute. (2025). Childcare assistance in New York State: Funding, access, and reform. https://fiscalpolicy.org
Gelbach, J. B. (2002). Public schooling for young children and maternal labor supply. American Economic Review, 92(1), 307–322. https://doi.org/10.1257/000282802760015748
Heckman, J. J. (2006). Skill formation and the economics of investing in disadvantaged children. Science, 312(5782), 1900–1902. https://doi.org/10.1126/science.1128898
High Scope. (n.d.). Research: Perry Preschool Project. https://highscope.org/research/
Kleven, H., Landais, C., & Søgaard, J. E. (2019). Children and gender inequality: Evidence from Denmark. American Economic Journal: Applied Economics, 11(4), 181–209. https://doi.org/10.1257/app.20180010
National Institute for Early Education Research. (2025). The state of preschool 2024: State preschool yearbook. Rutgers University. https://nieer.org
New York State Division of the Budget. (2026). Executive budget fiscal year 2026–2027: Education, labor, and family assistance. https://www.budget.ny.gov
New York State Legislature. (2026). Enacted budget SFY 2026–2027: Education and childcare provisions. https://www.nysenate.gov
New York State Office of Children and Family Services. (2024). New York State Childcare Desert Analysis, 2024. https://ocfs.ny.gov
Schweinhart, L. J., Barnes, H. V., & Weikart, D. P. (1993). Significant benefits: The High/Scope Perry Preschool study through age 27. High/Scope Press.
U.S. Census Bureau. (2024). American Community Survey 5-year estimates, 2019–2023. https://www.census.gov/acs
U.S. Department of Labor, Bureau of Labor Statistics. (2024). Consumer expenditure survey. https://www.bls.gov/cex/
Frederick Floss, Ph.D. is Professor of Economics, Finance & Public Administration at SUNY Buffalo State University. He serves as secretary of the City of Buffalo Fiscal Stability Authority.
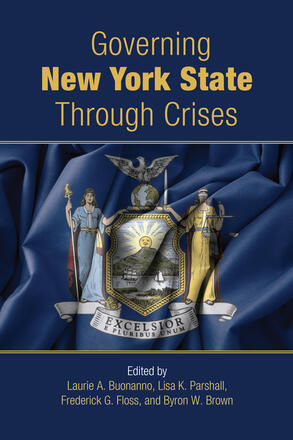
For more about the NYS budget, see Chapter 4 “Budgeting and Crisis” in Governing New York State Through Crises.


You must be logged in to post a comment.